As a new financial year gets underway in Australia, the media tends to be full of outlooks about what investors can expect for the coming 12 months. These pieces are often entertaining to read, but can be even more so a year later.
Scott Francis' latest Eureka Report article looks at the below average returns on the Australian share market since mid-2009 and compares this with previous perios after a major market downturn such as the GFC, 1987 crash, 1970s poor period of returns and the Great Depression.
Whilst the latest recovery period has not necessarily been different from the others mentioned, it does provide a stark reminder that a five to seven year window may not be enough to be confident that your share based asset classes will outperform cash.
Why five-to-seven years isn't adding up
Australian share market returns have been below their average since mid-2009.
Summary: Investors in Australian shares are on the cusp of a 10-year period of poor returns, with cash actually outperforming domestic equities since mid-2007.
Key take-out: The ‘five-to-seven-year’ rule for expecting a positive experience for investing in shares is being challenged, although post-GFC investors who used 2009 as a buying opportunity have been rewarded.
Key beneficiaries: General investors. Category: Shares.
As I started out as an investor, I remember thinking that managed funds would clearly be the best investment vehicle for me. They have the benefits of a professional manager and the administration is done for you. Also, while I didn’t fully understand them, I felt fees didn’t seem like too big a deal because I was confident my fund manager would outperform the average market.
I understand, now, that the reality of investing in managed funds is quite different. As I looked around the glossy fund manager brochure starting out as an investor, I noticed that the most common time frame suggested for a successful investment in a share-based managed fund was five to seven years.
One thing that the investment period from end-2007 to now has shown us is that the ‘five-to-seven’ year wisdom is not good enough for all periods. The Australian share market hit a peak in late 2007 closer to 7000 points than 6000 (the All Ords was 6779 in October of 2007).
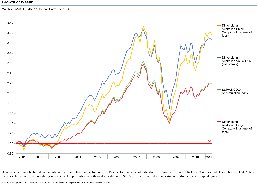
The following graph, based on average share market returns, provides some initial data for us to look at as investors over a nine-year period from July 1, 2007 to June 30, 2016 – close to the market peak through to this year. It is worth noting that nothing particularly dramatic has happened in the months since July that would substantially change this – leaving us right now about six months away from a 10-year period of poor returns, well beyond the ‘five to seven’ year period often cited as a holding period for growth assets.
Chart 1: Total returns (income and growth) from asset classes – July 1, 2007 to June 30, 2016
Source: Vanguard
Looking at this data, it is clear that the key Australian asset classes of listed property and Australian shares have provided an extended period of below average returns. In this case they trail the returns from cash. It is worth noting that the returns from these investments include both the price movement and dividends paid – in the case of Australian shares, the price movement has been negative over this period but a stream of income has been paid, leading to the overall positive return.
The bottom of the market then happened in early 2009 – in the case of Australian shares they fell in value by around 50 per cent (bottoming in the low 3000s). This is a tremendous loss of value but consistent with market falls in 1987, the early 1970s and the Great Depression in Australia.
So, what has happened since then? The following data shows the period from July 1, 2009 (just after the market bottomed) to June 30, 2016. It shows that investors who used 2009 as a buying opportunity have been rewarded. Interestingly, the worse performing asset class from 2007 to 2016 (Australian listed property) has had the strongest return since 2009.
Chart 2: Market 'rebound' total returns – July 1, 2009 to June 30, 2016
Previous 10-year returns from ‘tough market periods’
The 1987 crash is the most recent of the big falls in Australian markets, happening towards the end of 1987. To look at the 10-year recovery from this, we can look at returns from July 1, 1988 to June 30, 1998. Interestingly, as the following graph shows, the returns following this downturn don’t look all that different to what we are looking at in this current post Global Financial Crisis period – reasonable returns without anything particularly spectacular.
Chart 3: Post '1987 crash' returns – July 1, 1988 to June 30, 1998
The period in the early 1970s was also a poor period of returns from Australian shares. For the period June 1970 to June 1975 a $10,000 investment in the average share market portfolio fell from $10,000 to $6900 when you include the value of dividends received. This might not seem like a historically large fall, but when you consider that inflation was above 10 per cent for an extended period of time, it was a significant destruction of purchasing power for investors who owned shares.
Chart 4: Share market recovery – July 1, 1975 to June 30, 1985
This recovery seems spectacular enough with 18-plus per cent returns for a period of 10 years. I am sure we would all sign up to that today if we could. However, with inflation relatively high over that period, and cash returns of 12.5 per cent, the returns from shares were only 5.8 per cent higher than that – a reasonable return for the risk of investing in shares.
It is, of course, a little harder to find market data around the time of the Great Depression. A book of Australian Historical Statistics was produced for the Australian Bicentennial and contains some share market data back to the late 1800s. It shows that at June 30, 1929 the All Ordinaries index was at 52.5 points, and over the next two years fell to 30.2 points. This is consistent with a fall of around 50 per cent, as the highest and lowest points will have been more extreme than these end of financial year values.
The market then recovered over the 10 years from June 30, 1931 to almost exactly double to a value of 60.3 by June 30, 1941. Over this period the market yield was always above 4.5 per cent, with a peak of 8 per cent – adding to the returns from the price-index doubling.
Final word
Clearly the ‘five-to-seven-year’ rule for expecting a positive experience for investing in shares is challenged by this current period, where we are on the cusp of a 10-year period with negative price returns.
It is interesting to look back to previous market downturns; investors who were disciplined, and held Australian shares after a downturn, were rewarded over the next decade.
That said, I don’t think it can be argued that subsequent returns will necessarily be positive or exceptional, rather that shares have provided returns in excess of cash over these periods.
Early evidence is that this is certainly the case for investors who bought shares around the bottom of the market in 2009.
Hillary or Donald? Should investors be making adjustments to portfolios based on their view of the upcoming election? If history is any guide, you would be better served switching off the noise and focussing on the long term strategy.
A common discussion I have with new clients or existing clients adding funds into an existing portfolio is the issue of market entry risk. This is the risk that you purchase investments at a peak only to see values fall after entry. A strategy to moderate this risk that I canvas with clients is to spread out this market entry risk through either investing an immediate amount and then dollar cost averaging the remaining funds over a year or two or simply dollar cost averaging over a set period of time.
Jim Parker in his latest article for Dimensional sets out some thinking around this issue including the dollar cost average method I often use.
Have you ever seen a child standing tentatively at the edge of a swimming pool? She's torn between her desire to join the gang in the water and her fear of diving in. In committing to the market, investors can be like that.
You can always find a reason for not investing. "Perhaps I should wait till after interest rates rise?" goes one line of the thinking. "Or maybe I should delay till there's more clarity on China? Or hold back until after earnings season?"
Emotions and assumptions usually underlay this indecision. The emotion can be anxiety about "making a mistake" or fear of committing at "the wrong time" and suffering regret. The assumption is that there is a perfect time to invest.
Obviously, the ideal solution would be to enter the market just as it bottoms and exit the market right at the top.
But the reality is that precisely timing your exit and entry is close to impossible. If it were easy, millions would be doing it and getting very rich in the process. Instead, the only ones who tend to consistently make money out of market timing are those who write books about it.
The financial media certainly love market timing stories. For one thing, there is always some event or variable they can peg it to—like a decision on interest rates or upcoming earnings or a chart indicator. For another, the idea of timing the market is a powerful one and tends to get readers' attention.
For example, one high-profile US forecaster in early 2012 predicted a 50-70% equity market decline over the following two-to-three years. It was to be a replay of the 2008-09 crisis, he said, but with an even deeper recession.(1)
That turned out to be a bad call. Global equity markets, as measured by the MSCI World Index, delivered a total positive return in Australian dollars of 93% from the end of 2011 to the end of 2014. (2) In USD, it was 53%.
Others advocate more elaborate timing strategies. For instance, one recent academic paper suggested the stock market delivers better returns relative to Treasury bills in the second, fourth and sixth week after each of the US Federal Reserve's policy-setting meetings in a given year. (3)
The idea here is that the Fed leaks information about its interest rate intentions in such a predictable way that, even without the information, savvy investors can make money by just buying stocks in certain periods.
While these theories can be fascinating, it is arguable how many of us have either the time or inclination to try them out. And even if we did, this does not take account of the costs of all the required trades or the possibility that as soon as we implemented the idea it would be arbitraged away.
So ahead of a central bank meeting, some would-be investors fret about whether they should hold off until they see how the market reacts. Others already invested worry whether they should take their money out.
The truth is that for long-term investors, these issues should be irrelevant. What matters is how their portfolios are structured and how they are tracking relative to their chosen goals. Markets will go up and down, security prices will change on news and it makes little sense to second guess them.
But while no one yet has come up with a consistently successful strategy for timing the market to perfection, there are some things that everyone can do to help ease the anxiety they feel about investing.
One is to realise that it does not have to be a choice between being 100% in the market and 100% outside. Ideally, an investor should stick to their strategic asset allocation—be it 70/30 or 60/40 or 50/50 equity/bonds.
Another is that this strategic allocation can be combined with periodic, disciplined rebalancing, in which the investor shifts assets from well performing asset classes to those less favoured. This is a good way of controlling risk without necessarily trying to time the market.
A third option is that there is nothing wrong with investors taking into account the returns they have already enjoyed and adjusting their asset allocations if they are on course to meet their goals. So, for example, for some investors it might make perfect sense to lock in returns after a good period and put the money into short-term fixed income if that meets their needs.
Yet another option is dollar-cost averaging. This is a method where an individual invests small amounts of an available pool of cash into the market over a period, rather than investing a lump sum in one go.
A useful contribution on this subject comes from Ken French, Professor of Finance at the Tuck School of Business at Dartmouth College. In his role as an academic, Professor French says the optimal decision is to invest it all at once. But while this might give an individual the best investment outcome, he says it might not be the best investment experience. (4)
This is because people tend to feel regret more strongly when it results from things they did do than from things they did not. So, for instance, it feels much more painful to buy stocks now and see the price go down than it is to neglect to buy stocks and the price goes up.
Professor French says that by dollar cost averaging, people can diversify their "acts of commission" (the stuff they did do) as opposed to their "acts of omission" (the stuff they didn't do).
"The nice thing is that even if I put my finance professor hat back on, it's really not that damaging to your long-term portfolio to just spread it out over three or four months," he says. "So if you as an investor find that's much more tolerable for you, you're not really doing much harm."
So, in summary, it's always difficult to choose exactly the right time to get into or out of the market. For instance, it would have been nice to get out in late 2007 and back in around early March 2009.
But most mortals are unable to finesse it to that degree. The good news is that there are other options than just staying out of the market altogether and plunging back in.
These include maintaining a long-term strategic asset allocation in the first place, periodically rebalancing, taking money off the table if retirement goals are on track and dollar-cost averaging if that provides comfort.
(1) “Get Set for a Crash, Forecaster Says”, Globe and Mail, 10 January, 2012.
(2) MSCI World Index (net div, AUD), Returns Program.
(3) “Want to Play the Market? Count the Fed Leak Weeks: Study”, Reuters, 21 November, 2015.
In his latest Outside the Flags article, Jim Parker from Dimensional Fund Advisors looks back at some of the individual company share forecasts made at the end of 2014.
Aside from reports on shark attacks and cricket, the onset of the festive season and summer in Australia and New Zealand are traditionally lean times in the news business. So the forecasters come out to play.
Thinly staffed newsrooms and the prospect of lots of blank space to fill over the holidays prompt hard-pressed editors to assign reporters to crank out "Year Ahead" features before they go on leave.
For readers of the finance pages, this means lots of surveys about the outlook for the economy and markets in the coming 12 months. These can be diverting at the time, but they're much more entertaining a year later.
In its 'Top 100 Picks for Investing in 2015', published between Christmas and New Year, 'The Weekend Australian' newspaper canvassed staff and contributors for their recommendations on stocks to buy.
In its heavyweights list ("energised to move"), the paper selected BHP Billiton. It was energised all right, but the movement was all down. By early December, BHP had delivered a negative return of more than 30%.
The other chosen heavyweight was Alumina, which was picked because of expectations of improved prices and returns. Unfortunately not, as it turned out. Alumina was down nearly 27% over the year.
In the oil and gas sector, the newspaper asked "have prices hit bottom?" Clearly not, because four of its five favoured picks (AWE, Otto Energy, Origin Energy and Carnarvon Petroleum) were 30-55% lower. The fifth, Woodside Petroleum was a mere 6% lower.
Never mind, the paper said. Lower petrol prices would leave people more to spend. So it favoured consumer stocks Thorn Group and Carsales.com. The latter managed a 3% gain for the year, but Thorn was down 27%.
In financials, the newspaper said Treasury Group (later Pacific Current Group) was "fuelled to fly". Its stock delivered a negative return of 33% year-to-date. Gold stocks were "ready to rise"—like Independence Group (-40%). And watch out for the "rising stars"—like Colorpak (-18%), Nearmap (-44%) and Retail Food Group (-16%).
To be fair, there were also a few successful picks in the top 100, like food maker Bellamy’s, whose 12-month total return was more than 600% thanks to Chinese panic buying of its organic baby formula.
But the real issue is that building portfolios around bottom-up analysis of the prospects for individual stocks or sectors is not a sustainable or systematic way of investing. You might get lucky. But then again, you might not.
In a concentrated portfolio, idiosyncratic influences can have an outsized effect. For instance, The Australianpicked software developer Infomedia as an IT play. But the non-renewal of a key buyer agreement forced a profit downgrade and its stock was down around 40% for the year.
However, even in a well-diversified Australian portfolio, it can be hard to avoid the drag from heavyweight stocks like BHP Billiton. Facing plunging commodity prices and an environmental disaster in Brazil, its stock hit 10-year lows recently.
The Australian market is small by global standards and highly concentrated, the New Zealand market even more so. That’s why it makes sense to diversify as much as possible across different countries, sectors and stocks.
The idea is not to think of your portfolio in terms of individual stocks, but in terms of the broad drivers, or dimensions, of returns. These are your exposure to the market itself, to low relative price stocks, to small company stocks and to profitable stocks.
These dimensions of return have been shown to be sensible, backed by evidence, persistent and pervasive across different markets. Most of all, they are cost-effective to capture in diversified portfolios.
Of course, there is still no guarantee you won’t have a bad year in the market, but you can take comfort from knowing your portfolio is built around systematic differences in expected returns, not the whims of a newspaper.
It has been a number of months since we updated the website with Scott Francis' articles published in the Eureka report. We have now caught up and welcome you to take a look at these pieces - 17 in total.
The latest S&P Indices Versus Active Funds (SPIVA) Scorecard has been released in the US. Australian investor might ask what has that got to do with investors here in Australia? We think it is very important for two reasons:
Most likely 50% of an Australian investor’s international share exposure is invested in US companies.
Academic research continues to show that the largest share market in the world provides a guide as to what will and does happen in markets around the world including the much smaller Australian share market
So what does the latest report tell us?
Yet again the US SPIVA Scorecard finds that active fund managers, those charging significant fees and spending significant resources to choose investments that will beat the average market, are failing to beat the benchmark S&P Index.
For the twelve months to the end of June, 2013:
59.58% of large cap funds,
68.88% of mid cap funds,
64.27% of small cap funds,
62.59% of global funds,
65.86% of international funds, and
74.53% of emerging markets funds all underperformed.
The only winning sectors for active managers were the US small cap growth sector and international small cap sector.
The five year data was even more condemning of active managers.
(Refer to the full SPIVA report for further details.)
What are the lessons for investors in Australia?
The key lesson for us Australian investors is that we need to be very careful in employing active fund managers as all we may be doing is helping the fund managers to buy their yachts, mansions and expensive cars and not actually providing any value to our portfolios. Many studies show that a key reason for the underperformance is the extra fees that have to be paid to the fund managers. This creates a headwind that is difficult for them to overcome.
There are many other reasons and we encourage you to take a look at our research pages to understand more about why active managers are not likely to be a great investment choice.
Please be in contact if you would like to discuss how to apply this research to your particular circumstances – scottk@acleardirection.com.au
For many years I have followed the writings and podcasts of Paul Merriman, a financial adviser based in the USA. Recently Merriman has retired but continues to write and publish on financial advice particularly investment advice topics. In a recent article 10 do's and don'ts for retirement investors he looks at 5 key dos and 5 key dont's in retireement. Even though the comments are focussed on retirees in the US the broad concepts are just as relevent for us here in Australia. So here are the 10 items for your consideration:
Retirement do’s
Do take advantage of “the only free lunch on Wall Street” by building a diversified portfolio of mutual funds (managed funds in Australia). This will reduce your risk and probably increase your returns.
Do buy funds with the lowest possible expenses. The average equity fund charges more than 1.3% a year, yet you can get most of the asset classes you need in good funds for a full percentage point less than that. This is equally important for bond funds.
Do buy index funds instead of actively managed ones. This will be a big help in achieving both of the prior “do’s” I mentioned.
Do invest in equity asset classes with long histories of successful returns. Based on years of careful study by academics I trust, this means U.S. large-cap blend, U.S. large-cap value, U.S. small-cap, U.S. small-cap value, international large-cap blend, international large-cap value, international small-cap blend, international small-cap value, and emerging markets. And for tax-deferred accounts only, it means U.S. REITs. (In Australia the asset classes include Australian large-cap companies, Australian value style companies, Australian small-cap companies, International large/value/small cap companies, emerging markets and Australian and international REITs)
Do invest in the most tax-efficient manner. Unless you have unusual circumstances, that means maximizing your IRA and 401(k) accounts and (when you’re living off your money in retirement) using up your taxable accounts first. (In the Australian context this is about effectively utilising superannuation and superannuation pension accounts)
Retirement don’ts
Don’t pay a sales commission to buy or sell a mutual fund. The commission is money that’s gone forever from your nest egg, and it inevitably and permanently diminishes the return you will get. (In Australia you can no longer buy funds that have commissions attached but any existing managed funds may still maintain a commission structure.)
Don’t buy funds in asset classes with low expected returns or high levels of risk relative to their expected returns. Among the most prominent examples of asset classes you should avoid are commodities, gold and technology stocks. In addition, I think you should steer clear of pure growth funds, whether they invest in large-cap, midcap or small-cap stocks — and this includes international funds as well as U.S. funds.
No matter how much you are attracted to an active manager, don’t buy actively managed funds. This is really another way of stating my third point above. Actively managed funds are guaranteed to have higher expenses than index funds, and their returns aren’t likely to be as high as those of index funds.
Don’t speculate with your portfolio, even a small part of it “for fun.” If you have a properly diversified portfolio along the lines that I recommend, your investments will include all the “great opportunities” you will ever need. Speculating and playing the market will almost surely reduce your long-term returns.
If you absolutely can’t resist trying your luck, then spend (notice I am not saying “invest”) a bit of money that you can afford to lose and buy a lottery ticket.
Don’t get snookered into thinking you have found a guru or anybody else who knows what will happen to the market in the future beyond statements such as “Stocks will go up in the long run.” Many people claim to have that knowledge, but nobody does. The sooner you can accept this fact the sooner you will be in touch with reality.
When you are in touch with reality, you are likely to invest more intelligently and productively.
These are great insights from a man with many more years of experience than me and well worth consideration for you investment portfolio.
Scott Francis has just published his latest article in the Eureka Report looking at the topic of gearing - Gearing up: It's all in the timing.
The article provides some food for thought for those contemplating a gearing strategy to build wealth. With interest rates at historical lows it might be an interesting time to implement such a strategy for those who have a very aggressive risk profile.
However, as Scott points out at the conclusion of the article, there are some serious considerations to take on board before jumping in such as the market timing "bet" you would be making and the decision not to hold cash or fixed interest assets that would be involved when using debt.
In my previous blog I mentioned the fascinating challenge in the UK which pitted Orlando the cat against students and a panel of market professionals to see who could invest £5,000 the most successfully across a one year timeframe. Orlando won and also beat the broad UK FTSE All-share market index by over 3%.
The professionals were well beaten by both Orlando and the index.
Jim Parker from Dimensional has followed up on this discussion with a more in depth discussion in his latest Outside the Flags article. Jim also discusses the forecast from a well known finance commentator at the end of December 2011 to sell down share holdings. This call did not turn out so well with what followed being a well above average year in 2012 for Australian shares.
By no means was this a scientific experiment so don't go out and get your household cat or dog (or octupus for those who remember Paul from the 2010 World Cup) to pick your investments. Rather build your portfolio around a well diversified portfolio of assets and minimise taxes and costs where possible.
You've heard the line about stock picking being better left to blind-folded, dart-throwing orangutans. Now there's new competition – from cats.
UK newspaper The Observer staged an experiment, pitting a panel of market professionals and a group of students against a ginger feline called Orlando in a competition to see who would have the most success in picking stocks in 2012.1
Each team invested a notional £5,000 in five companies from the FTSE All-Share index at the start of the year. After every three months, they could exchange any stocks, replacing them with others from the index.
The professionals used their experience, insights and market knowledge to select stocks. The cat's method was rather less elaborate. Orlando simply threw a toy mouse onto a grid of numbers allocated to stocks in the index.
The newspaper reports that while the cat was trailing the pros at the end of the September quarter, his feline intuition kicked in the final months. As a result, his portfolio increased to end 2012 at £5,542. This represented a gain of nearly 11% for the year, outpacing the index's 8.2% rise and shading the professionals' portfolio by 7%.
While this experiment was hardly scientific, it does provide another reminder about the difficulty of generating consistent above-market returns by picking individual stocks or making forecasts. And it's something to keep in mind when you are confronted by media and market prognostications for 2013.
While many forecasters began 2012 by issuing downbeat calls for equity markets - based on the ongoing Euro Zone crisis, China's slowdown and US political logjams – the market value of global equities increased by about $US6.5 trillion last year.
As one analyst quoted by Bloomberg noted, many pundits were too wrapped up in the "fear du jour" and failed to keep an eye on the big picture.
So it was in Australia, where one prominent television finance commentator said at the end of 2011: "The conditions are in place for a panic sell-off. It is not certain that it will happen…but the risk is now such that you must take action. I will be significantly reducing my already reduced exposure to equities possibly to zero".3
More fool him and commiserations to anyone who had the misfortune to act on his advice, because the Australian equity market delivered a total return in 2012 of 20% in local currency terms. Gains in many other equity markets were even stronger.
It should be plain by now that basing your investment strategy on someone else's forecast is a haphazard way to build wealth. No matter how diligent and expert your forecaster is, unexpected events have a way of messing up their expectations.
As well, those who insist on believing that forecasting is a sustainable investment strategy tend to under-rate the capacity of capital markets to very quickly build all those expectations into prices. You think markets will tank/soar this year? So does someone else and they're trading off that belief.
The good news is you don't need a crystal ball to build wealth. You just need a regularly rebalanced diversified portfolio of assets designed for your needs and risk appetite. You also need to keep an eye on costs and taxes.
Most of all you need to keep your cool and exercise patience. Like a cat.
1. 'Orlando is the Cat's Whiskers of Stock Picking', The Observer, Jan 13, 2013
2. Almost All of Wall St Got 2012 Market Calls Wrong', Bloomberg, Jan 4, 2013
APRA have recently released the rates of return for Australia’s 200 largest superannuation funds and it does not make great reading for Bookmakers Superannuation Fund. It has performed the worst over the past 5 years and second last over 9 years.
We became aware of the fund back in 2006 when a potential client was seriously looking at using the fund after some positive reporting including from Alan Kohler. To be fair the fund had provided some strong returns in the years to 2005 and had a low fee basis. (The fund became publicly available in September 2004.)
Unfortunately if you had joined the fund after it went public the results have been disappointing. If you serch for why returns have been poor a major reason was that the fund had a heavy exposure to investments held with MFS which failed in 2008.
This story reminds me of the Legg Mason Value Fund in the US. For 15 straight years through to 2006 the fund outperformed the S&P 500 index. In the five years later following it trailed the S&P 500 by more than an average of 7% per annum.
The clear message from both of these stories is to be very careful "chasing" active fund managersand advisers who report strong historical returns. History also shows us that keeping this performance going is extremely difficult. If you get in at the top of the wave you are potentially heading for a huge dumping.
The following editorial piece was published in Monday's Advocate newspaper by Peter Mancell, the Managing Director of FYG Planning Pty Ltd, in Peter's capacity as director of the Mancell Financial Group and director of FYG Planning.
Peter regularly publishes opinion pieces in The Advocate and I thought this one was well worth republishing here. In this week's piece Peter talks about the Bookmakers Superannuation Fund along with a really interesting story out of the UK where a cat has beaten stockbrokers in a stock picking challenge over a 12 month period.
I hope you enjoy the article.
Regards,
Scott
Bookies Finally Lose, While Cat Beats Brokers
Given the self important and often overpaid nature of the finance industry, each week often throws up at least one irony.
Last week there were two.
Firstly, APRA released the rates of return for Australia’s 200 largest superannuation funds.
The number one fund over the past five years was the Challenger Retirement Fund, while over nine years it was Goldman Sachs/JBWere’s corporate staff fund.
Of course as interesting as who finished first, is who finished last.
For those who’ve lost a little too much money on the horses over the years, they’ll be interested to know the Bookmakers Superannuation Fund came last over five years, and second last over nine years!
Between June 2008 and June 2012 the Bookmakers Superannuation Fund failed to have one positive yearly return.
I don’t know what their strategy is, but by the looks of it they might have done better ‘investing’ at the racetrack!
Secondly, the news out of England that a cat named Orlando managed to beat stockbrokers, fund managers and a group of schoolchildren in a stock picking challenge.
At the start of 2012 each group invested a hypothetical £5,000 in the FTSE (UK share market); the groups were allowed to revise picks every three months.
Orlando picked his stocks by throwing a toy mouse onto a numbered grid, while the experts used their knowledge.
After 12 months, Orlando’s portfolio had grown to £5,542, the experts’ portfolio to £5,176, while the schoolchildren’s portfolio fell to £4,840.
While the schoolchildren finished last, they did perform the best in the final quarter which led to some misplaced optimism from their deputy headmaster, Nigel Cook.
“We are happy with our progress in terms of the ground we gained at the end and how our stock-picking skills have improved,” Mr Cook said.
Despite his students being shown up by a cat, Mr Cook still missed the point of the exercise.
Stock picking remains futile and you can’t ‘improve your skills’ at it because no one can predict financial markets with any certainty.
Peter Mancell is a director of Mancell Financial Group and FYG Planners AFSL/ACL 224543, www.mfg.com.au This information is general in nature and readers should seek professional advice specific to their circumstances.
Mancell Financial Group
First Floor, 10 Wilson Street, Burnie TAS 7320| Tel: (03) 6440 3555| Fax: (03) 6440 3599 | emailmfg@mfg.com.au| Web:www.mfg.com.au
Mancell Financial Group ABN 29 009 541 253 is an Authorised Representative No. 226266 and Credit Representative No. 403187 of FYG Planners Pty Ltd, AFSL/ACL No. 224543
I am in the process of writing a client update for clients reflecting on the past year and looking forward. The overall results have been pleasing with all major investment asset classes (barring cash) performing strongly.
If we look back at where we were at the beginning of January 2012 I think it would be fair to suggest that sentiment was poor. 2011 returns had been poor for everything other than bonds. There did not seem to be any major progress with the European debt crisis, growth was slowing in China and the US had only a few months previous been through a bruising political period culminating in the downgrade of the credit rating of US government debt. Not a great environment to provide confidence for the year ahead.
So why did things turn out so much better than what we might have expected?
The key driver in markets through 2012 seemed to be the hunt for yield underpinned by developments that were more positive than expected:
1) Increased Central bank stimulus measures including here in Australia.
2) The Chinese economy seems to have picked up after what appears to have been a stable political transition.
3) The US avoided the fiscal cliff ... for now.
4) Euro breakup fears eased after the head of the European Central Bank (ECB) Mario Draghi saying that the ECB will do whatever it takes to save the Euro
So what can we learn from the events of 2012?
Three really crucial lessons were evident for me:
1) Whilst current news might look negative (or positive), it's what happens next that is important for investment markets.
2) Trying to predict the next move for markets is very difficult.
3) The benefits from diversification are alive and well.
Jim Parker from Dimensional thrashes out these points in a little more details in his latest Outside the Flags article - Many Happy Returns. The article included some interesting data about returns from 20 developed markets and 20 emerging market some of which you might find surprising. I have included his article below.
Here's to a good year for 2013 hopefully with plenty of surprises on the upside!!
The summer holiday season encourages media retrospectives about financial markets. It's fun to match these up with what people were saying a year before.
In December, 2011, the publication Barron's told investors to "buckle up". The consensus prediction of its panel of 10 stock market strategists and investment managers was for the US S&P-500 to end 2012 some 11.5% higher at about 1360. 1
"That sounds like a big gain, but a lot of things have to go right for the market to make such impressive headway," the writer said. "Even the most bullish of these Street seers fears stocks could be more wobbly in the next six months than in the six months past."
There was so much for forecasters to get right - a negotiation of the Euro Zone crisis, uncertainties over the growth of earnings, the roadblock of the US presidential election and the challenge for emerging economies to sustain high economic growth rates.
More than a year later, markets are still grappling with many of the same issues, though from different angles. Much of Europe is either in recession or growing only modestly, unemployment is high and a number of countries that share the single currency are unable to pay their debts. The US presidential election gave way to worries over the so-called "fiscal cliff", while Chinese exports have been hit by the slowdown elsewhere.
In the meantime, however, there have been solid gains in many equity markets, including parts of Europe and Asia, as well as North America. That Barron's panel forecast of the S&P-500 reaching 1360, which the magazine said was ambitious, turned out to be conservative. The index ended the year 13% higher at 1426. What's more, some of the strongest performances have been in emerging and frontier markets.
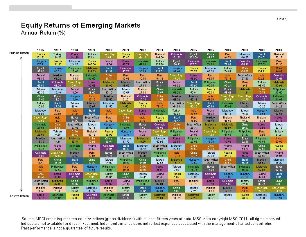
The table below shows performances for 2012 (to December 31) and annualised returns for the past three years of 20 developed and 20 emerging markets, using MSCI country indices. Returns are ranked on a year-to-date basis and expressed in Australian dollars.
Among developed markets, three members of the 17-nation Euro Zone - Belgium, Germany and Austria - were among the top performing equity markets last year. Leading the way among emerging markets was Turkey, which regained its investment grade ranking from agency Fitch in November.
While not one of the very top performers, the Australian market nevertheless delivered solid returns of 20% for the year despite the difficult international circumstances and the uncertainties at home over the extent of the slowdown in the domestic economy.
And while much of the media focus has been on the so-called BRIC emerging economies of Brazil, Russia, India and China, the real stars in the emerging market space these past three years have been the south-east Asian markets of the Philippines, Thailand and Indonesia.
There a few lessons from this. First, while the ongoing news headlines can be worrying for many people, it's important to remember that markets are forward looking and absorb new information very quickly. By the time you read about it in the newspaper, the markets have usually gone onto worrying about something else.
Second, the economy and the market are different things. Bad or good economic news is important to stock prices only if it is different from what the market has already priced in. My research colleague Jim Davis has done an interesting study on this. 2
Third, if you are going to invest via forecasts, it is not just about predicting what will happen around the globe. It also requires that you to predict correctly how markets will react to those events. That's a tough challenge for the best of us.
Fourth, you can see there is variation in the market performance of different countries. That's not surprising given the differences in each market in sectoral composition, economic influences and market dynamics. That variation provides the rationale for diversification - spreading your risk to smooth the performance of your portfolio.
So it's fine to take an interest in what is happening in the world. But care needs to be taken in extrapolating the headlines into your investment choices. It's far better to let the market do the worrying for you and diversify around risks you are willing to take.
In the meantime, happy new year and many happy returns!
1. 'Buckle Up', Barron's, Dec 19, 2011
2. Jim Davis, "Economic Growth and Emerging Market Returns", Dimensional, August 2, 2006
I came across this really interesting article published by the Economist looking at who they claim to be the biggest con-man in history - Financial crime: The king on con-men
The article looks at a fascinating example from the early 19th century in London where investors were conned into investors in bonds for a fictitious Central American settlement Poyais. Well worth a read if you are interested in
The practical element from the article that caught my eye looked at why people fall for fraud. It refers to research out of Boston University by Tamar Frankel based on the study of hundreds of financial cons. The research suggests that the following are recurring traits of victims:
- Excessively trusting
- Have a high risk tolerance
- Have a need to feel exclusive or part of a special group
The article also refers to other research suggests that victims tend to:
- Harbour dissatisfaction with their current economic status
- Desire not to be left behind
- Feel envious of economic neighbours
This all leads to greedy or risk investing.
Many of us shake our heads when we hear of others being trapped by financial fraudsters and ask how could someone fall for the outrageous claims they make. Reading the list of characteristics might lead many of us to rethink our perceived safety from financial fraud. We could easily fit into the class of potential victim.
So what's the investment lesson?
A key to avoiding making the same mistakes as financial fraud victims of the past it is really important to carefully question any investment that you get into. Look for total transparency and not a black box where you really don't understand what you are investing in and finally seek trusted professional advice before jumping in.
Happy New Year!! I hope that 2013 will be a happy, healthy and succesful year for all readers of this blog.
The start of a new year encourages reflections on what happened in 2012 and what is likely to happen next.
Weston Wellington, from Dimensional Fund Advisors in the US in his latest commentary piece reminds us that much of what was predicted for 2012 didn't happen:
The plunge off the so-called fiscal cliff was averted.
The euro zone did not fall apart.
China’s economy and stock market did not crash.
The bond market did not implode.
The re-election of President Barack Obama did not derail the US market.
Doomsday did not arrive on December 21, as some interpreters of the Mayan calendar suggested it would.
It goes to show that trying to predict the future for investment markets is near impossible. This proposition is backed up by a myriad of historical and contemporary research showing the great difficulty in being successful with an active approach to management of your investments
So if you are prone to try to make such predictions and consequently make big bets with your investment portfolio, go away, have a cuppa and then come back to your investment portfolio with the objective of a building a portfolio structured for the long term and not on the latest whim.
Judging by the headlines in the financial press, investors spent much of the past year anxiously awaiting one calamity after another that failed to occur. The plunge off the so-called fiscal cliff was averted. The euro zone did not fall apart. China’s economy and stock market did not crash. The bond market did not implode. The re-election of President Barack Obama did not derail the US market. The “flash glitch” in early August did not lead to further trading disruptions. Doomsday did not arrive on December 21, as some interpreters of the Mayan calendar suggested it would.
Instead, the belief that owning a share of the world’s businesses is a sensible idea appears to be alive and well, despite suggestions from some observers that the “cult of equity” is dead. For the year, total return was 16.42% for the MSCI World Index in local currency, and 16.00% for the S&P 500 Index. Among forty-five global stock markets tracked by MSCI, only three posted negative results in local currency (Chile, Israel, and Morocco), and twelve markets had total returns in excess of 25%, with Turkey leading the pack at 55.8%. Although much of the financial news over the past year highlighted Europe’s fragile financial health, most of the region’s equity markets outperformed the US, including Austria, Belgium, Denmark, France, Germany, the Netherlands, Sweden, and Switzerland. For US dollar-based investors, results were further enhanced by a modest decline in the US dollar relative to the euro, the Danish krone, and the Swiss franc.
As is so often the case, earning the rewards offered by the world’s capital markets may have required a combination of discipline and detachment that eluded many investors.
2012 Index and Country Performance
Total return (gross dividends) for 12-month period ending December 31, 2012.
A piece in the Sydney Morning Herald last month reported on a study conducted by Goldman Sachs. The study found that Australians plan to stick with local shares or cash and term deposits - Investors stay close to home.
Recent history has shown that this investment philosophy has provided mixed results.
On one hand, Australian shares over the past decade (to the end of November 2012) have significantly out-performed international developed country markets as a whole when those exposures have not been currency hedged.
On a currency-hedged comparison basis (i.e. removing the impact of the rise of the Australian dollar over the past decade) returns from those same international markets have still been lower but much closer.
On the other hand, international fixed interest and international listed property have significantly out-performed their Australian counterparts.
Emerging Markets exposures have out-performed Australian shares slightly.
Cash and term deposits have under-performed fixed interest (bond) exposures.
But what has happened more recently?
International shares on a currency hedged basis have significantly out-performed Australian shares over 1 and 3 year periods.
International shares without currency hedging have out-performed Australian shares over 3 years and slightly under-performed over 1.
International listed property has significantly outperformed Australian listed property over 3 years with performance equal over 1 year.
International fixed interest has beaten Australian fixed interest over 1 & 3 years with both beating cash and term deposit indices over the same time period.
Whichever way you look at the data, an Australian centric basis for choosing investments has provided mixed results at best.
The data along with the theory should remind all Australian based investors that there is more to building a successful investment portfolio than simply using Australian shares and Australian cash and term deposits.
Regards, Scott
Jim Parker in his latest Outside the Flags article looks at how share markets around the world have fared in 2012. He concludes with 4 lessons from the year:
1) Markets are forward looking and absorb new information very quickly.
2) The economy and the market are different things.
3) If you are going to invest using forecasts you are not only predicting what will happen around the globe but also how markets will react to those events.
4) Returns from various markets vary considerably, the need for diversification is evident.
The holiday season encourages media retrospectives about financial markets. It's fun to match these up with what people were saying a year before.
In December, 2011, the publication Barron's told investors to "buckle up". The consensus prediction of its panel of 10 stock market strategists and investment managers was for the US S&P-500 to end 2012 some 11.5% higher at about 1360.1
"That sounds like a big gain, but a lot of things have to go right for the market to make such impressive headway," the writer said. "Even the most bullish of these Street seers fears stocks could be more wobbly in the next six months than in the six months past."
There was so much for forecasters to get right – a negotiation of the Euro Zone crisis, uncertainties over the growth of earnings, the roadblock of the US presidential election and the challenge for emerging economies to sustain high economic growth rates.
Twelve months later, markets are still grappling with many of the same issues, though from different angles. Much of Europe is either in recession or growing only modestly, unemployment is high and a number of countries that share the single currency are unable to pay their debts. The US presidential election gave way to worries over the so-called "fiscal cliff", while Chinese exports have been hit by the slowdown elsewhere.
In the meantime, however, there have been solid gains in many equity markets, including parts of Europe and Asia, as well as North America. That Barron's panel forecast of the S&P-500 reaching 1360, which the magazine said was ambitious, is now looking conservative. The index was 4% above that level by mid-December. What's more, some of the strongest performances have been in emerging and frontier markets.
The table below shows performances for 2012 (to November 30) and annualised returns for the past three years of 20 developed and 20 emerging markets, using MSCI country indices. Returns are ranked on a year-to-date basis and expressed in Australian dollars.
Among developed markets, three members of the 17-nation Euro Zone – Belgium, Germany and Austria – were among the top performing equity markets this year. Leading the way among emerging markets was Turkey, which regained its investment grade ranking from agency Fitch in November.
While not one of the top performers, the Australian market has delivered positive returns despite the difficult international circumstances and the uncertainties at home over the extent of the slowdown in the domestic economy.
And while much of the media focus has been on the so-called BRIC emerging economies of Brazil, Russia, India and China, the real stars in the emerging market space these past three years have been the south-east Asian markets of the Philippines, Thailand and Indonesia.
There a few lessons from this. First, while the ongoing news headlines can be worrying for many people, it's important to remember that markets are forward looking and absorb new information very quickly. By the time you read about it in the newspaper, the markets have usually gone onto worrying about something else.
Second, the economy and the market are different things. Bad or good economic news is important to stock prices only if it is different from what the market has already priced in. My research colleague Jim Davis has done an interesting study on this.2
Third, if you are going to invest via forecasts, you need to realise that it is not just about predicting what will happen around the globe, but it is about predicting correctly how markets will react to those events. That's a tough challenge for the best of us.
Fourth, you can see there is variation in the market performance of different countries. That's not surprising given the differences in each market in sectoral composition, economic influences and market dynamics. That variation provides the rationale for diversification – spreading your risk to smooth the performance of your portfolio.
So it's fine to take an interest in what is happening in the world. But care needs to be taken in extrapolating the headlines into your investment choices. It's far better to let the market do the worrying for you and diversify around risks you are willing to take.
In the meantime, many happy returns!
1. 'Buckle Up', Barron's, Dec 19, 2011
2. Jim Davis, "Economic Growth and Emerging Market Returns", Dimensional, August 2, 2006
In his latest Outside the Flag article Jim Parker, Dimensional Fund Advisors, looks at the depressing demise of the Ross Asset Management investment business in New Zealand. The firm has gone into receivership after reporting returns of 25% a year since 2012.
Jim provides 5 key lessons for investors: 1) Be skeptical with any scheme promising consistently positive returne; 2) Any investment based on a few stocks or a fe sectore is extremely risky; 3) Never undertake an investment without first receiving independent advice and better still; 4) Don't build an investment based on a manager's supposed ability to predict the future; 5) Rather, build it on a clear investment philosophy, a transparent investment process, an approach based on evidence rather than forecasts or intuition and a consistent application with proper safeguards for investors.
These are important lessons from what has been a terrible result for the hundreds of investors involved.
You can find Jim's full article following.
Regards, Scott
Some myths die hard. One is the notion that there are people who can pick winning investments year after year without ever losing money.
Take boutique New Zealand investment business Ross Asset Management (RAM), which has gone into receivership owing clients hundreds of millions of dollars.
New Zealand's Serious Fraud Office has launched an investigation into RAM, whose Wellington offices were raided by regulators in November following complaints from investors that they were unable to get their money out.
RAM was headed by financial advisor David Ross and worked out of a small office with just two support staff.
Some 900 individual investors were attracted by the group's reported returns, which receivers PricewaterhouseCoopers estimated at 25 per cent a year since the year 2000.
Yet while Ross claimed to be holding investments worth nearly half a billion dollars on behalf of clients, PwC found records of just $10 million. The whereabouts of the rest is unclear. While not making any direct claims of fraud, both PWC and the Financial Markets Authority have said RAM had "characteristics of a Ponzi scheme".
Under such a scheme, a manager reports false and inflated returns and pays out these false returns to investors from contributions made by new investors. The problem with such schemes is managers have to keep reporting high returns, even if they are false, to attract new money in order to meet withdrawals.
Certainly Ross appeared to have convinced a sufficient number of people to keep money coming in. One client was quoted saying that Ross "seemed to know everything about what was going on in the market" and had a "fantastic" track record.1
This supposed track record was based on a strong bias towards small, high-risk mining stocks, very concentrated portfolios, the lack of any audit record and the reliance on a single individual with no back-up expertise.
The investment performance of RAM's funds was reported without any independent verification or audit. There was no independent custodian. As well, receivers found no record of broker transaction statements, no record of portfolio valuations, no broker contract notes and no registry records.
Just to put RAM's losses into perspective, assuming investors in the RAM funds lose everything, the total loss in proportion to the size of the New Zealand economy will be about twice that of the Bernie Madoff Ponzi fraud in the US.
While the upshot of all this is a depressing one - hundreds of people look to have lost their life savings – it nevertheless provides a number of key lessons for investors everywhere.
Firstly, one should be sceptical about any scheme that promises consistently positive returns – well above the market – year after year. Not even Warren Buffett has managed to beat the US S&P-500 these past three years.2
Risk and return are related. So it is possible to outperform the market, but not without accepting more risk. Besides, if you were consistently able to generate 25-30% returns, why would you share your insights with anyone else? You wouldn't need to.
Secondly, any investment based on a few stocks or a couple of sectors – like RAM claimed to be doing – means taking on unnecessary risk. That's a gamble, not an investment. By contrast, diversification allows you to capture broad market forces while reducing the uncompensated risk associated with individual securities or sectors.
Thirdly, you should never under-take an investment without first receiving independent advice from a fiduciary paid by you to do due diligence on the opportunity and to tailor a strategy to your needs, not based on what they have to sell. In the case of RAM, Ross was both providing the advice and investing the money. And he was doing so without an independent custodian. That should have rung alarm bells somewhere.
Finally, it is not a good idea to make an investment based on the supposed ability of an individual to forecast the future. Aside from the fact that there is no evidence that anyone can do so with any consistency, it means the success of your investment is a highly-correlated to an individual's expertise or integrity.
A better idea is to insist on a clear investment philosophy, a transparent investment process, an approach based on evidence rather than forecasts or intuition and a consistent application with proper safeguards for investors.
No-one can guarantee a positive return every year. But you can be sure that a structured approach based on the principles of modern finance and the efficacy of capital markets will add value with higher reliability and confidence than one based on instinct and prophecy.
1. 'Amazing Returns Lured Investors', The Dominion Post, Nov 17, 2012.
2. 'Buffet Trails S&P-500 for Third Straight Year', Bloomberg, May 3, 2012
I have recently written in a blog about a problem I have with unitised "big bucket" super funds in pension phase - the way they force you to sell down growth assets at times that might not be ideal to do so.
Scott Francis in his recent Eureka Report - Feeling the pension pinch - thrashes this issue out in greater detail.
The solution is to build a distinct cash hub from where pension payments can be drawn and interest and income can be paid into, supported by a significant defensive fixed interest component.
An investor should never be forced to sell growth assets to pay pension payments at the wrong time.
Scott Francis in his latest Eureka Report article calls on managed funds to provide after-tax return data to assist investors making accurate comparisons between funds - Tax shroud keeps investors in dark .
A Clear Direction also supports this call and are confident that it would show that the investment approaches applied by the firm stack up even better when using after-tax return data due to the minimal trading and limited distribution of capital gains paid out by our chosen investment managers.
The article was a summary of a piece published in the Washington Post by Barry Ritholz, a columnist for the paper.
The importance of having an awareness and knowledge of these biases is to help protect yourself from making poor decisions that you will live to regret. In a nutshell they include:
Confirmation Bias – the act of coming to a conclusion first and then looking for evidence to support that conclusion.
Optimism Bias – having over confidence in our own judgment above the judgment of others.
Loss Aversion – losses hurt more than the joy of the same amount of gains.
Self-Serving Bias – the good that happens is our doing, when things go against us it is the fault of someone else.
The Planning Fallacy – the tendency to underestimate the time, costs, and risks of future actions but at the same time overestimate the benefits.
Choice Paralysis – too many choices lead us to doing nothing.
Herding – the tendency to follow others.
We Prefer Stories to Analysis – including the tendency to look backwards and create patterns to fit events and then constructing a story that explains what happened along with what caused it to happen.
Recency Bias – the tendency to extrapolate recent events into the future indefinitely.
The Bias Blind-Spot – the tendency not to take into account these biases when making decisions. (NB - The link to the original article provides more in depth discussion of each bias along with links to further details.)
We can either trust ourselves to take into account these behavioural biases before making financial (including investment) decisions or we can look to professional help from financial advisers, accountants etc to provide a sounding board.
A good adviser can talk through the pros and cons from hopefully an unbiased viewpoint. This might mean you still go through with your plan but it will have been put through and benefitted from a rigorous analysis along the way.
The decisions financial advisers counsel against making are often (if not more) important than the proactive advice they provide.
Regards,
The latest ASFA Retirement Standard has been published looking at the period ending 30th September 2012.
The latest figures suggest:
A modest lifestyle for a single person will cost $22,539 per annum
A comfortable lifestyle for a single person will cost $41,090 per annum
A modest lifestyle for a couple will cost $32,511 per annum
A comfortable lifestyle for a single person will cost $56,236 per annum
An interesting aspect to consider is the level of increase or inflation in these levels from one year to the next.
The increases for the past year have been:
A modest lifestyle for a single person - 2.65%
A comfortable lifestyle for a single person - 1.68%
A modest lifestyle for a couple - 2.34%
A comfortable lifestyle for a single person - 1.66%
The official Australian Bureau of Statistics data for Consumer Price Inflation (CPI) for the period ending the 30th of September 2012 saw prices increase by 2.0%.
The Retirement Standard data suggests that prices are rising faster than CPI for those living a modest lifestyle whilst those living more comfortably seeing prices rise less.
The ABS data suggests as much with two of the largest rises in prices over the past 12 months being in the area of health and housing (including electiricty & gas).
How to apply this data?
The cost of living in retirement differes from one household to the next but the retirement standard provides a useful benchmark to test your level of planned and real expenditure in retirement.
The other major use is to get a sense of rising costs in retirement and to plan accordingly?
How to plan to protect against inflation in retirement?
Unfortunately the firt major lesson is that investing all of your income producing assets in cash is unlikely to successfully fight inflation through 20 to 40 years of retirement. We all need to build in other asset classes that will help fight inflation. We believe a major component of these assets for Australians are dividending yielding company shares along with carefully structure fixed interest (bond) investments.
If you would like to knowmore about our approach please be in contact.
Spending a lot of time in Indonesia I read the local papers, talk to local business owners and managers and sit in places like Starbucks watching what is going on. The economy is growing strongly with a lot of that growth coming from investment in the resource industry but also strengthening internal consumption via a growing middle class. The malls are full, cars are selling strongly and a growing prosperity is easy to identify.
(NB There is still extreme levels of poverty but the signs are positive.)
This runs counter to the outlook we get from major news and media outlets suggesting the world economy is a basket case. No doubt there are major problems to be dealt with but the news is not all bad.
Jim Parketr in his latest Outside the Flags article, reproduced below, looks at some interesting data about the two major economies in the Asian and emerging market economies of the world. he points to a similarly positive outlook. Well worth a read.
The financial crisis and subsequent developed world recession have overshadowed changes in the developing world that have implications for investors everywhere.
These changes–detailed in a landmark new Australian government report on Asia's economic rise–reveal an historic transformation which has shifted the axis of global economic activity and which is creating a huge new middle class.
The report is full of eye-popping statistics. For instance, in the past 20 years, China and India have almost tripled their share of the global economy and increased their absolute economic size almost six times over.
By 2025, the region as a whole is projected by official forecasters to account for almost half the world's economic output.
Asia's Rising Share of World Output
Source: Conference Board. GDP is adjusted for purchasing power parity (2011 prices).
The macro-economic statistics are matched by equally arresting micro-economic detail. Between 2000 and 2006, for instance, around one million people were lifted out of poverty every week in East Asia alone. Japan, South Korea, Singapore and, more recently, China and India, doubled their incomes within a decade.
Growing productivity and expanding wealth are leading to improvements in education, housing, infrastructure and governance. The demographic dividend from rapid population growth and more skilled workforces has been rising savings rates.
But this isn't just an economic phenomenon. Lives are being changed for the better. In Indonesia, for instance, the report says children born today can expect to live to their late 60s on average, compared to just 45 in 1960.
What does all this mean for investors? It means a reality check for those downcast over media talk of the global economy coming to a standstill, of growth being a thing of the past and of innovation and progress stalling.
The downbeat mood might be understandable for those living in Europe or North America, but those of us in the Asia Pacific living in the neighbourhood of this massive transformation can still see plenty of cause for hope.
Rising prosperity and living standards in the world's most populous region mean rising business opportunities. Expanding businesses need increasing amounts of financial capital, raw materials and human capital.
With open markets and the free-flow of information around the world, this means opportunities for diversified investors everywhere, not just in Asia, to share in the wealth created via this transformation.
By early next decade, the combined output of China and India is expected to exceed the entire output of the established Group of Seven industrialised nations – the US, Japan, Germany, France, the United Kingdom, Italy and Canada.
"Asia will not just be the most populous region in the world. Asia will be the biggest economic zone, the biggest consumption zone and the home to the majority of the world's middle class," the Australian government report concludes.
"While the shape of the Asian century is not set in stone, there are good reasons to be optimistic. Even if there are economic cycles, as is likely, they will occur around a trend of rising income."
This might be an Asian story, but it is a global change for the better and one we can all share in as investors. It's a story worth keeping in mind when you are bombarded with the bad news from Europe and the US every day.
I follow the Humble Savers twitter feed to keep abreast of what is being discussed about financial planning services. A recent article – Financial Adviser Fees – the Cold Hard Facts - puts into question the fees being charged on investment portfolios suggesting that ongoing fees for a $200,000 investment portfolio could be 2.55% of the value of a portfolio with establishment fees of $4,500.
I don’t doubt that this is a reasonably common fee structure in the market place but not all advisers are charging so extravagantly.
So what are the fees at A Clear Direction?
I have looked at an all share based portfolio.
Establishment fees would be in the order of :
Plan Fee - $1,100 (may be more if there are other complex aspects to consider)
Investment fund buy/sell spread - $275
Administration Service transaction costs - $105
Total - $1,480
This is $3,000 less than the article suggests you might be paying.
Ongoing adviser fees would be in the order of:
Adviser Fees - $1,100 (0.55%)
Investment fund fees - $750 (0.37%)
Administration Service fees - $525 (0.26%)
Total - $2,375 (1.19%)
These are less than half of the proposed fees in the Humble Savers article.
We at A Clear Direction are totally conscious of the fact that higher fees burden the long term returns promised by portfolios and have worked hard to drive down the costs of doing business through removing unnecessary administrative costs of doing business, providing a sophisticated investment approach which realises keeping costs low is important and sourcing high quality administrative services at the lowest cost available for clients.
The costs to set up, administer, monitor and review an investment portfolio does not have to be outrageous and can allow you to focus on what’s important in your own life rather than having to worry about your financial planning.
I realise this is a bit of a strange title but I came across a fascinating article in the Wall street Journal which I had to share – Can you trust your stockjobber?.
Researchers led by financial historian Larry Neal of the University of Illinois have replicated all the holdings and trades in the Bank of England, the East India Co. and the United East India Co., the Royal African Co., the Hudson’s Bay Co., the Million Bank and the South Sea Co. –the dominant companies at the birth of British capital markets three centuries ago.
The share registries survive, so the scholars were able to match virtually every investment with the person who held it – encompassing 5,813 investors during the 1690s and 23,723 by the end of the period.
These people included everyone from dukes and other aristocrats to “stockjobbers,” or brokers, along with merchants, apothecaries, glassmakers, drapers and goldsmiths – and up to 27% of them were women.
The researches concluded that investors were:
underdiversified, with 86% of them owning shares in only a single stock;
chased performance, with rising prices leading to higher trading volume;
underperformed the market as a whole, earning lower returns and incurring higher risk.
Women appeared to be more conservative than men.
The WSJ article then goes on to compare those investors with investors today suggesting there is very little difference as investors today:
underdiversify, holding an average of only three stocks;
chase performance, with rising prices leading to higher trading volume;
underperform the market as a whole, earning lower returns and incurring higher risk.
A lot has changed in the world over 300 years but human nature has not. Smart investors can learn from the errors of history to better structure investment portfolios today:
be well diversified;
don’t chase performance rather invest in asset classes that haven’t been doing so well lately;
Technology is definitely bringing the world closer and closer together. Aspects of the investment world highlight this point. Investors can be sitting in the comfort of their own home trading seamlessly across markets right round the world.
As with many other areas of technological development, new capability does not always bring beneficial results to the masses but can lead to areas of exploitation and danger.
Jim Parker in his latest Outside the Flags posting, highlights this when it comes to currency trading.
I often reflect with clients that if they think equity markets are tough to gauge currency markets are much more difficult and hazardous.
Please take a look at Jim's insights in his article that has been reproduced below.
Vice President "Making money in the global markets is just a click away", the commercial promised, without mentioning that losses are just as instantaneous.
For many people, one consequence of poor investment returns over prolonged periods is that the lure of the easy-money, quick-fix trade becomes even stronger.
This is how marketers of foreign exchange trading programs – betting on currency movements "from the comfort of home" – are finding such a ready audience right now.
Despite horror stories of people losing fortunes in high-speed, leveraged and extremely speculative activity, the appetite for this casino approach seems stronger than ever.
In one case, an Australian online entrepreneur is being sued by US regulators over an allegedly fraudulent forex trading scheme that cost investors in the US, Australia, the UK, Germany and other countries more than $50 million. 1
According to the US Commodity Futures Trading Commission, the company 'Investment Intelligence' used online marketing to solicit clients worldwide to open currency trading accounts, lured by promises of a 9% monthly return and low-risk.
In one night in May, the CFTC said clients awoke to discover they had lost more than 60% of their investments. This occurred when the company entered more than 200 trades in each client's account, violating representations made to them earlier.
Of course, not all such online currency ventures are fraudulent. But there is often a large disconnect between the promise and the reality. Many ventures tell individuals that just by attending a short course and learning a few trading techniques, they can make substantial money via trading currencies from home.
But the reality is that even the most highly skilled and knowledgeable investors – including global banks with hundreds of analysts – have difficulty predicting movements in currencies with any consistent success.
In fact, none other an authority than the former chairman of the US Federal Reserve Alan Greenspan once said that predicting exchange rates has a "success rate no better than that of forecasting the outcome of a coin toss".
So if global institutions and central bankers say it's an impossible task, what are the chances of an ordinary person, working on their own at home with a software program and a few charts, making a living out of currency speculation?
Recognising this threat, the Australian Securities and Investments Commission has issued a warning to retail investors to exercise extreme care before committing to get-rich-quick, currency trading schemes and courses.
"Forex trading is very risky even if you have years of skill and experience in this type of trading," the commission says. "You will need plenty of spare money if you have to cover a margin call. Risk management systems such as stop loss orders, will only give you limited protection by capping your losses."
As well, ASIC warns of the dangers of 'counterparty' risk if the forex provider can't fulfil its obligations. Liquidity or technology issues can stop you being able to make a trade, margins or spreads can eat up any profit you make and promotional offers of trading being "free" or "no loss" inevitably have strings attached.
On top of all that, you are expected to remain constantly on top of what is going on in the 24-hour global forex market – a market where turnover totals $4 trillion each day, according to the Bank for International Settlements. And you must be aware of all this while living your non-trading life – sleeping, eating and seeing your family and friends.
It just defies logic that anyone could do all of this without going either broke, bewildered or insane - and perhaps all three.
1. 'Foreign Exchange Trading: Money Smart', ASIC, April 23, 2012
For the past 6 years the Legatum Institute based in London has ranked the world’s nation in terms of 8 criteria :
Economy Entrepreueurship & Opportunity Governance Education Health Safety & Security Personal Freedom Social Capital
Using these criteria the institute then provides an overall Prosperity Index.
Top of the rankings for the 2012 rankings were again the Scandinavian nations of Norway, Denmark and Sweden. Australia and New Zealand then followed in 4th & 5th.
We often hear the phrase the “Lucky country” and this prosperity index provides some interesting insights into why this might be the case not only for us who live here but for those looking in from the outside. The areas of particular strength were deemed to be Education, Personal Freedom & Social Capital.
An interesting aspect of this year’s report is the highlighting of the rise of the Tiger cub nations – Indonesia, Malaysia, Thailand and Vietnam - over the past 4 years. This is particularly interesting given the background of Australia’s recent white paper on engagement with Asia but also our close geographical links to this part of the world.
For me the key take aways are to reflect on and be proud of the prosperity we have in Australia but to continue to work hard and smart to keep this prosperity in place including strong engagement with nations in our own back yard.
As an investor, it suggests that placing confidence in our own Australian companies is warranted with the index also speaking to the grower prominence of not only China and India but also the ASEAN region of nations. A well diversified portfolio should be including exposure to this area of the world. We suggest clients do so through investing in the broad Emerging Markets asset class.
Regards,
Scott Keefer
A lot has been written and served up to us through advertising channels about the benefits of the low cost industry super fund network. At A Clear Direction we think that some industry super funds offer a good option for clients especially with low balance beginning their superannuation savings journey.
However, a major issue I have with the “Big Bucket” investment approach offered by these and other superannuation offerings comes to when you want to start drawing down on the balance to sustain your cost of living and lifestyle in retirement.
By Big Bucket approach I mean whereby you have a range of investment choices which hold a diversified pool of assets and you get to choose one or two of these choices.
The problem comes once you start to draw down. A few years ago you did not have the choice of targeting where to draw your payments from so you were forced into selling down a percentage of all the asset classes held in the fund. This thankfully has improved so now a member could have a cash option and draw all payments from there along with a balanced, moderate or conservative diversified option.
So a suggested structure within these big bucket fund is to have a holding of cash alongside a diversified investment option matching your required asset allocation.
This all sounds pretty reasonable. The problem in the structure is that the investment earnings generated by a particular investment option are not able to be directed back into the cash option to top it up. Rather they get automatically re-invested back into the investment choice from which they were generated. The end result is that you quickly see the cash component dwindle.
So what this means is that a member has to manually sell down assets from the diversified balanced, moderate or conservative option to top up the cash account. What you are doing is selling a range of asset classes. This includes selling down growth style assets such as shares and property.
If those investments have been steadily growing this is not a problem as we would be undertaking effective rebalancing. Unfortunately when growth asset markets are struggling, selling down these assets is locking in the losses or poor performance that has occurred.
Take the past 5 years as an example. We are still well away from seeing shares and listed property assets regaining the levels of late 2007. If we are forced sellers now we are locking those paper losses into real losses.
In my opinion a much more effective arrangement is to take control of where the income generated by assets is invested and in doing so reducing the need to be forced sellers of assets at a point in time.
Another interesting side issue is to know where administrative fees are being taken from in “Big bucket” accounts. Most likely it is across the investments proportionately. Here is another situation when you can become forced sellers when ideally it would be better not to do so.
At A Clear Direction we believe that you can have the benefits of a low cost superannuation service along with the necessary control to make sure you are not forced into making poor investment decisions along the way.
I read with interest a Sydney Morning Herald article that looked at a range of investors who had chosen to go down the DIY Self Managed Superannuation path – Master of Your Own Destiny.
One participant to the article suggested they had $7.6 million in their fund and were paying fees of approximately $100,000 per annum.
So I decided to look at what the fees would look like in 2 superannuation accounts of $3.8 million each using the cheapest available administration service I have at my disposal for that amount.
The following table sets out the total fees for the combined $7.6 million portfolio across a range of asset allocations:
60 / 40
50 / 50
40 / 60
30 70
Administration Service
$3,800
$3,800
$3,800
$3,800
Investment Managers
$24,600
$25,400
$26,200
$27,000
Adviser
$4,400
$4,400
$4,400
$4,400
Total
$32,800
$33,600
$34,400
$35,200
These numbers are based on using the standard investment philosophy suggested by the firm. If a client wanted to through in a direct shareholding component to the portfolio the investment manager costs would fall further.
Keep in mind that the members no longer have the responsibility of being trustees of their own fund plus they have shaved off more than $65,000 from their cost base.
I think this shows that the cost basis of A Clear Direction’s approach is extremely competitive for large portfolios and also puts into question the oft quoted perception of lower fees in SMSFs.
If you think you are paying too much please get in contact.
Last week Standard & Poors (S&P) released their latest SPIVA report into comparing active versus index returns looking at data up to the 30th of June 2012. The latest report continues to show that active managers outside the small cap asset class are on average doing worse than the benchmark index return.
The latest results were:
A majority of active funds underperformed their respective benchmarks across all asset classes studied in the SPIVA Australia Scorecard.
Over the last five years, approximately 69% of active retail Australian equity general funds failed to beat the S&P/ASX 200 Accumulation index.
Active Australian equity small-cap funds significantly outperformed the benchmark across all periods studied in this report. Over the last five years, almost 80% of active Australian equity small-cap funds outperformed the S&P/ASX Small Ordinaries Index.
Almost 90% of active international equity general funds underperformed relative to the benchmark over the last year. Over both three- and five-year periods, at least 72% of international equities general funds failed to beat the index.
All active retail Australian bond funds studied in this report failed to beat the S&P/ASX Australian Fixed Interest Index over the last year. Similarly, 92% of funds in this category underperformed the index over a five-year period.
Approximately 86% of active Australian A-REIT funds failed to beat the S&P/ASX 200 A-REIT Index over the last year. However, the portion that underperformed falls to approximately 65% over a five-year period.
The numbers continue to suggest that you are better places simply holding the various asset classes index (barring small caps).
At A Clear Direction we think you can do slightly better thanthis over the long term by incorprating exposure to small, value and emerging markets asset classes into the mix whilst still using an index style approach to those areas of the market.
If you would like to find out more please be in contact.
Three new articles written by Scott Francis have been added to the Eureka Report section of the website:
20/06/2012 -PE ratios: A new pathway to asset allocation- Using the PE ratios of different asset classes, we can build expectations of future investment returns from the earnings of different assets. The recent 75 basis point interest rate cuts makes cash a less attractive investment - something that looking at the PE ratios of asset classes shows. 11/05/2012 -Face-off: Shares always win after tax- When it comes to after-tax returns, it's clear that shares outperform bonds over the longer term. 09/05/2012 -Budget 2012: Time for a tax strategy rethink- This year's budget provides a good opportunity to make some subtle changes to your tax strategy.
There is no doubt that being an investor in the share market has been troublesome over the past 4 1/2 years. Here in Australia we are still well off the highs on the ASX of late 2007. All the economic and investment news we read appers bleak (at best). Why then should we persevere with holding company shares in this climate?
This very question has been raised by Weston Wellington (Vice President, Dimensional Fund Advisors) in his regular column- Down to the Wire. Weston reminds readers of the "Death of Equities" call back in 1979 after a similarly difficult investment period. What followed, not immediately but eventually, was one of the strongest bull markets in US history.
A recent article appearing in the Financial Times caught our eye—or perhaps we should say ear. At first glance it was unremarkable—just one among dozens of recent think pieces suggesting that investors were losing interest in stocks as markets around the world continued to stagnate.
But the tone of the article sounded remarkably familiar. We dug out our copy of the "Death of Equities" article appearing in BusinessWeek on August 13, 1979, to have a fresh look. Similar? You be the judge:
BusinessWeek, 1979:
"This 'death of equity' can no longer be seen as something a stock market rally—however strong—will check. It has persisted for more than ten years through market rallies, business cycles, recession, recoveries, and booms." Financial Times, 2012:
"Stocks have not been so far out of favor for half a century. Many declare the 'cult of the equity' dead."
BusinessWeek, 1979:
"Individuals who are not gobbling up hard assets are flocking to money market funds to nail down high rates, or into municipal bonds to escape heavy taxes on inflated incomes." Financial Times, 2012:
"The pressure to cut equity exposure is being felt across the savings industry. … In the US, inflows to bond funds have exceeded equity inflows every year since 2007, with outright net redemptions from equity funds in each of the past five years."
BusinessWeek, 1979:
"Few corporations can find buyers for their stocks, forcing them to add debt to a point where balance sheets seem permanently out of whack." Financial Times, 2012:
"With equity financing expensive, many companies are opting to raise debt instead, or to retire equity."
BusinessWeek, 1979:
"We have entered a new financial age. The old rules no longer apply." —Quotation attributed to Alan B. Coleman, dean of business school, Southern Methodist University Financial Times, 2012:
"The rules of the game have changed." —Quotation attributed to Andreas Utermann, Allianz Insurance
BusinessWeek, 1979:
"Today, the old attitude of buying solid stocks as a cornerstone for one's life savings and retirement has simply disappeared." Financial Times, 2012:
"Few people doubt, however, that the old cult of the equity—which steered long-term savers into loading their portfolios with shares—has died."
When the first "Death of Equities" article appeared, the S&P 500 had underperformed one-month Treasury bills on a total return basis for the fourteen-year period ending July 31, 1979 (107.0% vs. 119.6%, respectively). Was buying stocks in August 1979 a smart contrarian strategy? Yes, but only if one had the patience to stick it out for years. Imagine the frustration of an investor who had been counseled to "stay the course" in response to the "Death of Equities" article appearing in August 1979. Stocks did well for a while, jumping over 27% from August 13, 1979, to March 25, 1981, when the S&P 500 hit an all-time high of 137.11. But by July 31, 1982, stocks had given back all their gains, and the S&P 500 was almost exactly where it had been nearly three years earlier. As of July 31, the S&P 500 had extended its underperformance relative to one-month Treasury bills to seventeen years (total return of 150.5% vs. 213.6%).
Imagine this same investor arriving at her financial advisor's office on Friday, August 13, 1982, with a three-year-old copy of BusinessWeek under her arm. Stocks had drifted lower in the preceding weeks, and the S&P 500 had closed the previous day at 102.42. "You told me three years ago to stay the course, and I did," she might have remarked to her advisor. "It hasn't worked. Obviously, the world has changed, and it's time I changed too. Enough is enough."
We suspect even the most capable advisor would have faced a big challenge in seeking to persuade this investor to maintain a significant equity allocation. For many investors, seventeen years is not the long term, it's an eternity.
Superstitions aside, stocks rose that day, with the S&P 500 advancing 1.4%. It wasn't obvious at the time, but August 13, 1982, marked the first day of what would turn out to be one of the longest and strongest bull markets in US history. The S&P 500 was 16% higher by the end of the month and went on to quadruple over the subsequent decade. The table below shows data for the S&P 500 on a price-only basis. With dividends reinvested, the return would be materially enhanced.
"Death of Equities" Anniversary
1st Anniversary
August 12, 1983
58.3%
5th Anniversary
August 12, 1987
224.5%
10th Anniversary
August 12, 1992
307.9%
20th Anniversary
August 12, 2002
782.4%
(Almost) 30th Anniversary
June 19, 2012
1,225.9%
One of the authors of the FT article, John Authers, is familiar with the BusinessWeek article and wary of making pronouncements that might look equally foolish ten or twenty years hence. In a follow-up article appearing several days after the first, he appealed for divine assistance in his forecasting effort: "O Lord, save me from becoming a contrarian indicator." Nevertheless, after revisiting his arguments he remained persuaded that the climate for equities was too hostile to be appealing.
We should not use this discussion to make an argument that stocks are sure to provide investors with appealing returns if they just wait long enough. If stocks are genuinely risky (which certainly seems to be the case) there is no time period—even measured in decades—over which we can be assured of receiving a positive result. Nor should we seize on every pundit's forecast as a reliable contrarian indicator. With dozens of self-appointed experts making predictions, some of them are going to be right. Perhaps even John Authers.
The notion that risk and return are related is so simple and so widely acknowledged that it hardly seems worth arguing about. But these articles (and others of their ilk) offer compelling evidence that applying this principle year-in and year-out is a challenge that few investors can meet, and explains why so many fail to achieve all the returns that markets have to offer.
References
"The Death of Equities," BusinessWeek, August 13, 1979.
John Authers and Kate Burgess, "Out of Stock," Financial Times, May 24, 2012.
John Authers, "The Cult of Equities Is Dead. Long Live Equities," Financial Times, May 27, 2012.
S&P data are provided by Standard & Poor's Index Services Group.
Stocks, Bonds, Bills, and Inflation Yearbook. Ibbotson Associates, Chicago (annually updated work by Roger G. Ibbotson and Rex A. Sinquefield).
In his latest Eureka Report article, Buffett's dividend secret , Scott Francis looks at a key characteristic of Australian shares - their ability to outperform inflation through dividend growth.
Even during the tough conditions experienced on the ASX since late 2007, dividends have continued to grow.
In a tough investment climate like this it is very appealing to give up on shares and rather stick your money in cash or even bonds. However history tells us that an exposure to Australian shares will also be helpful in fighting of the impact of inflation over the medium to long term.
I encourage you to take a look at Scott's article,
Many adherents to an active management approach to investing profess that you can successfully pick when to enter and exit markets so as to achieve a better result than the average market return.The mantra rings true for a lot of investors – surely if you put enough research and effort into it you can beat the markets.
Each year Dalbar looks at this very issue by analysing the fund flows into and out of mutual funds in the USA.(Mutual funds are like our managed funds here in Australia.)They publish their results in the Quantitative Analysis of Investor Behavior (QAIB) report. - http://www.qaib.com/public/default.aspx
The latest report has just been published and does not make good reading for the “Active Timers”.The report shows that over the course of 2011, the average equity return for investors in equity market funds was negative 5.73%.This sounds all right to Australian investors where the ASX200 returned negative 10.54% but in the US the S&P500 actually eked out a gain of 2.12%.
So the average investor underperformed the S&P500 index by 7.85%.The report also showed that bond fund investors underperformed the Barclays Aggregate Bond Index by 6.50%.
The report goes on to show that over 3, 5, 10 and 20 year time periods the average equity investor has underperformed – a massive 4.32% per annum over the 20 year period.
Yet again the Dalbar study has shown that investors who have tried to pick the best time to enter and exit markets have failed to get it right.You were much better off just holding on to the relevant index.
We in Australia may think we are smarter than the average American investor but my gut instinct suggests similar results would be replicated in Australia.
Regards,
I have just come across an article published by McKinsey & Company in October. It looks at the ability of company executives to time share buy backs in the USA -
Many of us would expect that company executives have some kind of insider knowledge that would allow them to better time the purchase back of company shares. Unfortunately the study undertaken by McKinsey suggested anything but such skill. In fact, 77% of companies did worse in their timing of share buybacks compared to simply gradually buying back shares regularly over time.
Another powerful reminder of the dangers of trying to time entry into and out of share investments.
If you had held cash during the past 4 years of equity market turmoil you would probably be pretty happy with yourself. Some may even be contemplating staying in cash or at least a lot larger allocations of cash going forward. Unfortunately just as there are risks when investing in shares, holding cash has its own key risk - preserving purchasing power. The official cash rate at present is 4.25%. With inflation running at 3%, probably higher for those in retirement, you can quickly see that cash is not offering much of a return above inflation.
Brad Steiman from the Canadian branch of Dimensional has looked at the tension between two key goals of most investors - Preserving Capital or Preserving Purchasing Power. He has looked at data spanning back 111 years which is made available though the Dimson Marsh Staunton database. The key conclusion is that the risks from investing in shares are discernible immediately whereas the risks from investing too much in cash, which is just as great a risk, may only be identified many years later.
Please find Brad's article following.
The Tradeoff: Preserving Capital or Preserving Purchasing Power
Brad Steiman, Northern Exposure
Director and Head of Canadian Financial Advisor Services and Vice President
Click on the following link to listen to a podcast of this article - podcast
Many aspects of life require careful consideration and balancing of the tradeoffs that arise from competing demands. For example, a common lifestyle tradeoff is working longer hours versus spending more time with your family. The competing demands within this decision are the income necessary to provide a suitable quality of life for your family versus the immeasurable benefits of quality time with your family. There is no right answer, but most people understand the tradeoff and attempt to find the balance that is right for them.
Successful investing and financial planning also require balancing tradeoffs. For example, a common investment tradeoff is that of risk and return. One of the competing demands is preservation of capital versus preservation of purchasing power. The former may allow for a better night's sleep during periods of heightened uncertainty and corresponding volatility, but the latter helps ensure you'll have a comfortable bed in the future when accounting for rising prices from inflation. Once again, there is no right answer, no "optimal" solution. Understanding the tradeoffs between preserving capital and preserving purchasing power will help investors find the balance that is right for them. This balance will depend on their definition of risk and attitude towards it.
Some investors may consider risk to be volatility. They have difficulty stomaching the daily ups and downs associated with investing in asset classes that experience significant price fluctuations, such as equities, because declining prices are often accompanied by predominantly negative headlines. Although information will be reflected in prices before one can react to it, this is little solace to investors who extrapolate the recent past into the future and see the bad news as an indicator of what's to come rather than a commentary on what has already happened. These investors yearn for short-term preservation of capital.
Other investors may define risk as a diminishing standard of living. They have long-term financial obligations, such as spending during their retirement years, and their primary goal is building wealth to meet those future expenses. They recognize that, while the cumulative effects of inflation are sometimes glacially slow or even undetectable in real time, inflation can be the silent killer of a financial plan. These investors desire long-term preservation of purchasing power.
Investing is relatively straightforward when the definition of risk and attitude toward it are so black and white. For example, you can virtually guarantee the preservation of capital by investing in the equivalent of Treasury bills as long as you accept the corresponding potential for the loss of purchasing power. On the other hand, you can preserve purchasing power by investing in asset classes with expected returns exceeding inflation, providing you accept price fluctuations that can temporarily impair your capital.
Unfortunately, in practice, investing isn't that simple. Individual investors rarely have black and white objectives or well-defined definitions of and attitudes towards risk. Some expect long-term preservation of purchasing power and short-term preservation of capital. Making matters worse is the tendency for the priority and relative importance of their competing demands to change through time, often in response to what's happened in the recent past.
Investors who succumb to the cycle of fear and greed end up chasing a moving target. Advisors can try to mitigate this destructive behavior by focusing investors on the tradeoffs that were made at the outset when determining their balance between assets that are expected to grow faster than inflation and those that stabilize the portfolio and reduce its fluctuations. So if an investor is now fearful and therefore more focused on capital preservation, it is time to reframe the tradeoffs by emphasizing why growth assets were in the portfolio to begin with and how the so-called "riskless" asset (i.e., bills) can actually be extremely risky in the long run.
For example, Table 1 contains annualized returns from Australia, Canada, the US, and the UK for more than a century. Bills only slightly beat inflation before tax, but this small return advantage can easily disappear on an after-tax basis.1 Nonetheless, the table clearly demonstrates that equities have delivered returns exceeding both bills and inflation by a wide margin, even when accounting for taxes.2
Table 1: Annualized Nominal Returns (1900–2010)
Country
Inflation
Bills
Equities
Australia
3.9%
4.6%
11.6%
Canada
3.0%
4.7%
9.1%
US
3.0%
3.9%
9.4%
UK
3.9%
5.0%
9.5%
In local currency. Dimson Marsh Staunton (DMS) Global Returns Database. Past performance is no guarantee of future results.
However, the tradeoff for pursuing higher expected returns of equities is accepting the risk of substantial declines compared to the relative stability of bills. Table 2 shows that equity values in the four markets have dropped from 50–69% over a two- to six-year period, whereas bills have always been flat or better (if you consider minus 2 basis points a rounding error).
Table 2: Worst Performing Periods for Equities and Bills, Nominal Returns (1900–2010)
Equities
Bills
Country
Period
Total Return
Period
Total Return
Australia
1970–1974
–50%
1950
0.75%
Canada
1929–1934
–64%
1945
0.37%
US
1929–1932
–69%
1938
–0.02%
UK
1973–1974
–61%
1935
0.50%
In local currency. Dimson Marsh Staunton (DMS) Global Returns Database. Past performance is no guarantee of future results.
The risk and return relationship from a preservation of capital perspective is apparent in these nominal returns, but the picture is a bit different after considering the impact of inflation. In terms of preserving purchasing power, now the "riskless" asset looks far from risk free.
Table 3 contains the biggest peak-to-trough declines, in real terms, for equities in these four countries over the same time period. It likely comes as no surprise that the magnitude of the real declines is substantial, with stock prices dropping anywhere from 55–71% after inflation. However, the duration of the declines is still relatively short, ranging from two to five years, and it took equity investors in these countries anywhere from three to eleven years to break even.
Table 3: Worst Performing Periods for Equities, Real Returns (1900–2010)
Peak to Trough Decline
Subsequent Recovery
Country
Period
Total Return
Years
Years
Australia
1970–1974
–66%
5
11
Canada
1929–1932
–55%
4
3
US
1929–1931
–60%
4
4
UK
1973–1974
–71%
2
9
In local currency. Dimson Marsh Staunton (DMS) Global Returns Database. Past performance is no guarantee of future results.
In contrast, the data in Table 4 for bills, or the "riskless" asset, in these four countries is revealing. The biggest peak-to-trough declines after inflation now remarkably range from 44–61%, a similar order of magnitude to equities. Furthermore, the duration of the declines extends to a range of seven to forty-one years with investors in bills waiting an astounding seven to forty-eight years to recover!
Table 4: Worst Performing Periods for Bills, Real Returns (1900–2010)
Peak to Trough Decline
Subsequent Recovery
Country
Period
Total Return
Years
Years
Australia
1937–1977
–61%
41
21
Canada
1934–1951
–44%
18
34
US
1933–1951
–47%
19
48
UK
1914–1920
–50%
7
7
In local currency. Dimson Marsh Staunton (DMS) Global Returns Database. Past performance is no guarantee of future results.
More than ever, comparisons like these are needed when discussing the tradeoff of preserving capital versus preserving purchasing power. Investors feel the risk of equities in real time. Volatility is immediate and apparent as their portfolio value shows up in the mail every month or on their computer screen every day. Conversely, the risk of investing in bills and other low-volatility assets is less discernible and may take time to detect as it shows up when investors open their wallet at the grocery store or gas station many years later.
Investors may still want to revisit the tradeoffs they made and alter course if appropriate. However, changes to a long-term plan should reflect an informed decision rather than an emotional one. Fear and greed are powerful forces, but we should resist letting them dictate the tradeoffs we make in our lives or in our portfolios.
Many thanks to Marlena Lee for compiling this data from the Dimson Marsh Staunton (DMS) Global Returns Database.
1. Returns in this table are pre-tax, but actual consumption, as represented by inflation, requires after-tax dollars; therefore, if the marginal tax rate on interest income exceeds [1 – (Inflation/Bill Return)], the real return is negative. (e.g., Canada: [1 – (3.0/4.7)] = 36% but the highest marginal tax rate on income is roughly 45%.)
2. The difference in the real return of equities versus bills would increase after taxes in countries where the tax rate on income exceeds the tax rate on dividends and capital gains.
As outlined in Jim Parker's latest Outside the Flags commentary, 2012 has started much more positively for investment markets with all major asset classes followed by this firm showing gains for the first 2 months of the year. This is an obvious turnaround tofromthe doom and gloom seen in the last half of 2011.
We should not become too optimistic as markets have an awful habit of disappointing just when we think the worst is behind us, but what we can take away are two key reminders as to the fundamentals of investing:
- It's important to be patient and take a longer term approach, and
- Don't get caught up in the hype and emotion put out by the financial media and make knee jerk decisions either on the up or down side
'And you thought 2011 was tough?' So went the headlines in December as media and market pundits, reflecting on a miserable year, saw no respite for investors in 2012. But markets have a funny way of confounding expectations.
To be sure, the reasons to be anxious were piling high as the year turned, with European politicians dithering over how to tackle a tottering mountain of sovereign debt, policymakers in the US running short of options and emerging markets not providing the cushion that many investors had hoped for.
The general view, as expressed through the media, was that there would be more muddling through in early 2012. "Buckle up!" warned the respected Barron's magazine. "For investors frightened by the stock market's volatility in the past six months and tired of worrying about places in Europe once given little thought, 2012 promises scant comfort — at least in the first half."
As an investor, if you had taken that advice you might be ruing it now, as global equity markets — as measured by the MSCI World index — have registered their best start to a calendar year in 21 years. The index was up by just over 10% in US dollar terms as of the end of February. You have to go all the way back to 1991 to find a better start.
Added to that is that much of the leadership for the turnaround is coming from the US, an economy that many observers just two years ago were writing off in favour of the emerging powerhouse economies in Asia. The US benchmark S&P–500 was up by 9.0% to the end of February. This is also its best start since 1991 and returns the index to the levels of June, 2008, before the Lehman collapse.
The US market's strong start followed a standout 2011, in which it was one of the best performing markets in the world. And that included most of the emerging markets.
Even Europe, the epicentre of concerns for much of the past year, has exploded out of the blocks in 2012. The Euro Stoxx 50 was up by nearly 12% over the first two months of the year, with the German market rising by close to 20% in US dollar terms.
The renewed buoyancy extended to Asia, where the MSCI Asia Pacific Index has registered 10 consecutive weeks of gains, its longest uninterrupted winning streak since 1988, and powered by strength in energy stocks. Australian stocks have firmed as well, to be up 12.5% year to date in US dollar terms — although in local currency terms, the gain has been less stellar at just over 7%.
Why the change in mood? There are several catalysts for the turnaround in markets so far in 2012.
First, by the end of last year, market participants were discounting a lot of bad news, including a couple of catastrophic scenarios. Fears of mass defaults in Europe and a possible break–up of the euro were seen as entirely possible.
While Europe can hardly be described as being out of the woods yet, the agreement by creditors on a new round of official funding for Greece has eased nerves, as has the European Central Bank's provision of another half a trillion euros in cheap funding to financial institutions.
Second, there have been signs of a turnaround in the US economy, at least compared to the view the market was taking a few months ago. At that time, another recession was seen as on the cards. Since then, official data have shown an improvement in the labour market, a rise in manufacturing orders and a climb in consumer confidence.
Third, central banks are pumping out massive amounts of cheap cash — essentially printing money — to provide liquidity to the financial system and to support the recovery. As well as the ECB's latest cash injection, Japan and Britain have recently extended their so–called "quantitative easing" programs, while China has the cut the reserve requirements for its banks.
Of course, just as it was wrong to extrapolate the pessimism of last year through into 2012, it would be foolish to forecast that the rest of this year will resemble the first two months in tone. No–one knows how markets will perform going forward, because that requires an ability to forecast news. You can always guess, of course, but we tend to think that's not a sustainable investment strategy.
The point of this is to highlight the virtues of discipline and the tendency of markets to absorb news very, very quickly and to look forward to the next thing. Unless you know what the next thing will be, you are wise to stay in your seat.
The latest SPIVA Scorecard (Standard & Poors Indices Versus Active funds) has been released and even though there has been some slight improvement for active fund managers since the last report, the overall news remains bleak.
The key findings were:
·The S&P/ASX 200 Accumulation Index has outperformed at least 60% of active Australian equity funds over the periods of one year or more. The S&P/ASX 200 Accumulation Index has outperformed approximately 63% of active Australian Equity General funds over the last five years.
·Active Australian Equity Small-Cap funds have significantly outperformed the benchmark across all periods studied in this report. Over the last five years approximately 80% of active Australian Equity Small-Cap funds have outperformed the S&P/ASX Small Ordinaries Index, with this majority increasing to 90% over the last year. Both the equal- and asset-weighted average returns of the active fund category have far outperformed the S&P/ASX Small Ordinaries Index across all periods studied.
·With the exception of active Australian Equity Small-Cap funds, a majority of funds across all categories have failed to beat their respective indices over all periods observed in this report. Over the last year at least two-thirds of active funds across most categories failed to beat their respective indices. Australian Equity Small-Cap funds are the only exception to this finding.
·At least 80% of active International Equity General funds underperformed relative to the benchmark over the last year. Over both three- and five-year periods, at least 62% of International Equities General funds have failed to beat the index.
·Over the last five years approximately 84% of active Australian Bond funds have failed to beat the index. However, over three years the underperforming percentage falls to approximately 62%.
·Approximately 57% of active Australian A-REIT funds have failed to beat the benchmark over the last five years, increasing to an even larger majority of 74% when taking into account only the last year. Over both three- and five-year periods, active Australian Equity A-REIT funds enjoyed the highest survivorship rate when compared to the other active categories covered in the SPIVA Australia Scorecard.
The only bright spot to mention for active managers is in relation to small caps.A major reason for the out-performance is that many small cap managers will dig a lot deeper than the S&P index which stops at the 500th largest company on the ASX. The manager we use for small caps uses an index style approach but invests in much smaller companies than just those in the ASX500.This fund has also significantly out-performed the S&P index by 2.11% through 2011, 3.47% p.a.over 3 years and 4.79% p.a. over 5 years.
Concluding Comments
This research again backs up our firm’s approach to build a portfolio around index style funds which promise lower fees and better than average performance compared to their actively managed counterparts.
Click on the following link for a copy of the full SPIVA report.
An important consideration when determining your optimal asset allocation mix is to consider the potential risks and rewards to be realised from various asset classes.
The events of 2008 clearly remind us of the risks involved with investing in volatile asset classes such as shares but what should we expect to achieve from these investments?
Each year Credit Suisse publishes their Global Investment Returns Yearbook which looks at historical returns for major markets.The 2011 yearbook which includes data up to the end of 2010 provides some very useful insights.
Over the 111 years of data available to the authors,
Equity returns have beaten inflation, treasury bills (short duration government debt) and bonds in all 19 countries included in the study.
Australia has been the best performing equity market with a real return of 7.4%.
The equity risk premium in Australia has been 6.7% over risk-free treasury bills.
The equity risk premium in Australia has been 5.9% over bonds.
The volatility experienced in Australian shares has been slightly higher than the global average.
A globally diversified portfolio of equities has provided a real return of 4.5% over Treasury bills and 3.8% over bonds
On top of this pure statistical analysis, the authors of the report – Dimson, Marsh, Staunton, Holland & Matthews provide analysis of two key investment issues:
Whether we are experiencing a bond market bubble and the implications for investors?
Whether chasing higher yielding share investments provides a better outcome over the long term?
The analysis contained in the report suggests that over the past 30 years, and especially the last 10 years, there have been strong returns from investing in bonds on a par with or better than equity returns across the globe.(Australian shares have out-performed Australian bonds over that period.) Over the long term bonds have provided less returns with less volatility which suggests the returns from the past decade have been abnormal.The authors therefore suggest that the strong performance from bonds should not persist especially within a low interest rate period with higher inflation expectations.
In terms of high yielding shares, the research clearly suggests there is a premium to be earned from investing in this style of shares over the long term as reflected in the long term historical data. Over short time periods higher yielding shares may under-perform so it is not a free lunch.
Conclusions So what can we take away from these findings? I believe that the report reconfirms a number of the approaches to investment applied in client portfolios:
If you can afford a long timeframe for your investments (preferably forever) than share investments do provide a significant premium over inflation, cash and bonds and should form a significant part of a portfolio.
It has been prudent to have an over-weight exposure to Australian shares being conscious that this may provide a slightly higher level of volatility.
Bonds have had a great recent performance history but this is unlikely to continue forever.However we should not expect to see huge falls in bond prices especially at the lower maturity, higher quality part of the market.
Bonds have provided a slight premium over more liquid defensive assets and therefore are a valid use as a part of an asset allocation to reduce volatility but provide a slightly higher return than investing in cash.
Incorporating a higher yield / value strategy into asset allocations is a valid approach to lift expected returns.
Please take a look at our Building Portfolios page for further details of our approach.
The final in a series of charts that have been uploaded to the site in recent days looks at 15 years of return history for 21 emerging markets up until the end of 2010.
The first page of the chart ranks the returns from each market year by year.
The second page breaks the chart down in alphabetical rather than year by year rank order.
An interesting take away was the under-performance of the BRIC markets - Brazil, Russia, India and China in 2010 and 2008. It is also interesting to see the huge swings in fortunes for markets from one year to the next.
It reminds us of the great difficulty in picking the best market in which to be invested in for the long term and also the risks involved with trying to pick "winning" emerging markets from one year to the next. We think holding a portfolio invested in all of these markets makes better sense.
Click on the image to view a full page printable pdf copy
We have updated the Dimensional Fund Performance Graphs page. The page includes periodic performance data, growth of wealth graphs and average performance bar charts for the previous 1 month, 3 months, 6 months, 1 year, 3 years, 5 years and 10 years.
Commentary: The graphs show a negative month of returns for all asset classes with all of the risk premiums under-performing the large company benchmarks. Over the long run, however, the data continues to clearly show the existence of the risk premiums (small, value and emerging markets) that the research tells us should exist:
Australian Share Trusts - 10 Year returns
10 Yr Return
to April 2011
Premium over ASX 200
Accumulation Index
ASX 200 Accumulation Index
8.20%
-
Dimensional Aust Value Trust
11.82%
3.62%
Dimensional Aust Small Company Trust
12.15%
3.95%
International Share Trusts - 10 Year returns
10 Yr Return
to April 2011
Premium over MSCI World (ex Aust) Index
MSCI World (ex Aust) Index
-3.52%
-
Dimensional Global Value Trust
-0.97%
2.55%
Dimensional Global Small Company Trust
1.95%
5.47%
Dimensional Emerging Markets Trust
7.95%
11.47%
NB - These numbers are annualised returns for the 10 year period.
However, academic theory is nothing if it can not be implemented and provide the returns that are promised by the research. Therefore, we like to provide the historical returns of the funds that we use to build investment portfolios.
Please let us know if you have any feedback regarding these graphs by using the Request for More Information form to the right or via our User Voice feedback forum.
Today we have uploaded a great chart looking at the market capitalisations of major world markets in terms of US dollars as at the end of December 2010.
The chart shows that Australia was only 3% of the entire world market. Some might ask why then do we suggest that Australian shares make up 50% or more of recommended growth asset allocations? Our investment philosophy takes into account research suggesting that the franking credit benefits offered by Australian shares are not fully reflected into the value of Australian shares as they are not available to non-residents. This suggests that over the long term there is an extra benefit from holding Australia shares for residents of Australia. However we also acknowledge that including international shares provides diversification benefits for a portfolio.
For more information about our approach please take a look at our Building Portfolios page.
Please click on the chart to view a full page printable pdf copy of the chart.
The end of financial year sees many of us looking at our taxable income to see how we can legitimately reduce the tax burden. There are a number of approaches recommended with some being totally acceptable where appropriate to your individual circumstances. The following ideas are common:
- salary sacrificing into super to reduce taxable income including capital gains
- prepaying investment loan interest payments
- making a superannuation contribution for a low income spouse
Another strategy that was more common before the GFC was to invest in agribusiness schemes which were provided friendly tax arrangements. Unfortunately many of these turned out to be poor investments and even though you could save some tax going in you lost a lot more through the failure or poor performance of the investment.
This is a key reminder for all of us that when searching for tax breaks it is crucial to weigh up the underlying investment first and then if this stacks up the tax break provides a bonus.
Unfortunately there are also promoters of a range of schemes that have gained the attention of the Australian Tax Office. The ATO have produced a handy guide - Understanding tax-effective investments - to assist tax payers determine whether a proposed approach will be allowed by the ATO. There are 16 categories mentioned including mortgage management plans, early access to super, scholarship trusts and a range of strategies around the use of trusts privately and in business.
The key message from the guide is to carefully check the credentials of the provider of the advice and seek independent guidance. The ATO suggests the alarm bells should be going off with arrangements that:
Offer zero risk guarantees
Do not have a prospectus or product disclosure statement
Refer you to a specific adviser or expert
Ask you to maintain secrecy to protect the arrangement from rival firms and discourage you from getting independent advice.
At this time of the year it is easy to rush into an arrangement that sounds brilliant and will relieve the tax burden in months ahead. If you stumble into an inappropriate scheme the penalties are great not least of which is having the attention of the ATO squarely focused on you. A circumstance that I am sure most of us would prefer not to have.
Dr Shane Oliver is the Chief Economist at the AMP and is a regular commentator on the economy and its implications for investors. I do not always agree with his conclusions but I do think he is able to clearly articulate economic theory.
His latest contribution is an explanation of investor behaviour in an article written for the ASX - Why markets are irrational
You may think that it is strange that I refer to this article as this firm's investment philosophy is seemingly built on the backbone of the efficient market hypothesis and Dr Oliver clearly does not believe in this theory. However it is not that issue that I think is most useful in this article, it is rather the explanation of investor behaviour and concepts such as irrationality, the madness of crowds and why bubbles and busts occur. Dr Oliver, as do I, believe it is crucial for an investor to understand these concepts and act accordingly.
The concluded implications for investors from the article are:
Understand emotions. Investors need to recognise that investment markets are not only driven by fundamentals, but also by the often-irrational and erratic behaviour of an unstable crowd of other investors. Also, not only are investment markets highly unstable, they can also be highly seductive. Be aware of past market booms and busts, so when they arise in the future you doe not overreact – piling into unstable bubbles near the top or selling everything during busts and locking in a loss at the bottom.
Consider how you react. Recognise your emotional capabilities. Be aware of how you are influenced by lapses in your own logic and crowd influences. An investor should ask: “Am I highly affected by recent developments (positive or negative)? Am I too confident in my own expectations? Can I bear a paper loss?”
The right strategy. Choose an investment strategy that can withstand inevitable crises while remaining consistent with your financial objectives and risk tolerance.
Discipline. Essentially stick to your broad strategy even when surging share prices tempt you to consider a more aggressive approach, or plunging values might suck you into a highly defensive approach.
A contrarian approach. Finally, if tempted to trade, do so on a contrarian basis. Buy when the crowd is bearish, sell when it is bullish. Extremes of bullishness often signal market tops, and extremes of bearishness often signal market bottoms. But contrarian investing is not foolproof – just because the crowd looks irrationally bullish or bearish does not mean it can’t get more so.
The approach taken by this firm is focussed on points 3 & 4, getting the strategy right from the outset and remaining disciplined to that strategy. A major reason for this approach is to protect clients from themselves and letting emotions dictate decisions. If you can achieve this discipline around a strategy developed on strong principles you are streets ahead of the game.
One of the great traps with investing is the tendency to follow investments or asset classes that have done well in the past under the assumption or hope that they will do likewise in the future. Jim Parker in his latest commentary piece for Dimensional highlights some research showing the pitfalls with this approach.
Stars or Straws?
Jim Parker, Vice President, DFA Australia Limited
Investors frequently seek external validation to ease the anxiety of putting their money at risk. Problem is there is no guarantee that a "five-star" rating on a chosen fund will lead to a "five-star" investment experience.
It is human nature for consumers to seek comfort in the idea that the products they are buying are proven in the marketplace. That need is met by ratings agencies that play a legitimate and vital role in providing independent assessments of various investment products.
Those assessments are made in professionally compiled and detailed reports that can be a useful yardstick for investors and their advisors in comparing funds so that they can make a fully informed decision.
But despite diligent cautions from the agencies about chasing returns, problems arise when consumers blindly extrapolate star rating systems for various funds into imagined future performance.
The risks of this approach were highlighted in a survey by US private wealth management business Burns Advisory Group, which went back to 1999 to study the subsequent 10-year performance of Morningstar's five-star funds.1
Burns found that of the 248 funds rated five-star by Morningstar on December 31, 2009, only four were still receiving that rating a decade later. Of the original sample, 87 had ceased to exist. Of those still existing, all had been downgraded to an average of just under three stars. Even worse, in all categories except international stocks, the average performance for five-star funds over this 10-year period was worse than the average for all funds.
"These findings imply the star ranking methodology leaves long-term investors in the lurch," Burns concluded. "If nothing else, it demonstrates clearly why investors should not rely on one measure as their sole research tool."
But it is not just unsophisticated investors that are chasing performance. Another recent report suggests that even wealthy individuals and institutional investors can be blind-sided by past returns.
The study by researchers at the European School of Management and Technology, quoted in The Economist magazine, looked at how investors allocated money to hedge funds over 10 years from 1994.2
The researchers found that the funds that had performed well in the previous three quarters attracted significantly more money than their competitors. In other words, the supposedly "smart money" was chasing past returns.
Bear in mind, also, that indiscriminately chasing returns can be even more costly with hedge funds, which typically charge management fees of 2% or more, plus 20% of the returns they generate for clients.
Given the large body of academic evidence that it is extremely difficult to predict market returns with any confidence, it should be evident that past returns should not be the foundation for choosing one fund over another.
Leading academics Gene Fama and Ken French, in a recent study of mutual fund performance, showed how hard it is for investors to distinguish skill from pure chance in analysing the returns of individual funds.3
So what should an investor and his or her advisor weigh up in making a decision? The key here is to focus on items within their control, such as:
Are the risks being taken related to return?
Are those risks targeted in a reliable, consistent way?
How diversified is the fund?
Does it make promises it can't keep?
What is more important - individual judgement or clear processes?
Are the underlying strategies driven by forecasts?
Does the fund take account of costs and taxes in its decisions?
Does the fund manager communicate in a clear and consistent way?
While many of these attributes can lead to good outcomes for investors, they are no guarantee of positive returns every year. Anyone who makes those sorts of promises risks disillusioning those who put their faith in them.
But the above characteristics can give investors comfort that their money is being invested in a consistent, transparent way and that ensures that when the targeted premiums kick in, they are positioned to receive them.
This is a grounded, completely defensible approach. The alternative is that by reaching for the stars, investors are left clutching at straws.
1. McGuigan, Tom and Courtenay, Tim, Star Gazing: Five Star Funds Revisited, Burns Advisory Group, April 2010
2. Buttonwood, Who's the Patsy?, The Economist, May 29, 2010
3. Fama, Eugene F., and Kenneth R. French. 2009. Luck Versus Skill in the Cross Section of Mutual Fund Returns, SSRN
Professor Eugene Fama is famous for his work on the Efficient Market Hypothesis. His work in the 1990s with Kenneth French provides the core of the three factor model approach we use when structuring Australian and international share allocations for clients.
Professor Fama was interviewed last Friday on CNBC's "Squawk Box" where he provided his insights into whether the efficient market hypothesis is dead and the financial regulatory reform which is occurring across the globe. Following is the video taken from that interview. Well worth watching.